by
Paola Massoli
Sep 9, 2019 2:00:00 PM
 Greenhouse Gas Emissions of Electric Vehicles
In a recent post, we refreshed the notion of why driving an electric car is a better choice for the environment, even in areas that rely on fossil fuels for most of their electricity generation: in one word, efficiency. An electric vehicle is 3-4 times better at converting energy to miles driven compared to a combustion engine. In New England, the average electric car emits 73% less carbon dioxide (CO2) than a gasoline car on a per-mile basis. The emission reductions are even greater in the Massachusetts communities – and soon Rhode Island communities – that have adopted the model of green municipal aggregation.
Furthermore, a recent European study has concluded that electric cars are a better option for climate in 95% of the world already on a lifecycle basis, which includes manufacturing and end-of-life processes. While battery production certainly has environmental impact, there is a growing number of applications to give batteries a second life, turning a conundrum into opportunity, further reducing waste.
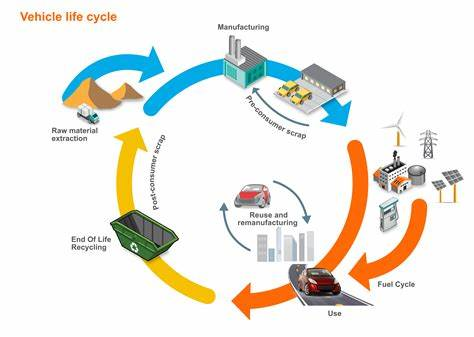
Illustration of a vehicle life cycle from raw material extraction to end-of-life.
In this blog, we dive deeper into the fuel emissions of transit and school buses in Massachusetts and Rhode Island.
Do Similar GHG Emission Reductions Hold True for Buses?
A bus can carry the equivalent of up to 60 single-occupancy vehicles, thereby reducing emissions – and congestion – simply by removing cars from the road. However, buses largely run on diesel, which, in addition to GHG, carbon monoxide (CO), hydrocarbons (HC) and nitrous oxides (NOx), produces black carbon when combusted. Black carbon is toxic, and a short-lived climate-change-forcing agent. Modern diesel and diesel-hybrid buses deploy pollution control technologies such as diesel particulate filters (DPF) and selective catalytic reduction (SCR) that cut particles emissions, HC, CO and NOx from 40% to 90% when working under perfect conditions. However, perfect working conditions depend on many factors (driving cycle, exhaust & ambient temperature, equipment maintenance, to name a few). Furthermore, there is no technology – except for fuel efficiency – that can reduce CO2 tailpipe emissions.
Luckily, zero-emission buses are here to help. In addition to eliminating tailpipe particles and NOx, electric buses also reduce lifecycle GHG emissions, much like passenger electric vehicles. In a study published last year, the Union of Concerned Scientists reported that while the average 40-foot diesel bus emits 2,680 grams of CO2 per mile (g/mi), an electric bus charged on the average U.S. energy mix emits 1,078 g/mi, roughly a 50% reduction. In some areas where coal prevails in the electricity mix, emission reduction is lower (40%). But in areas with more clean energy, GHG reductions can amount up to 70-80%.
What about in Massachusetts and Rhode Island? We performed specific GHG reduction calculations for the largest transit agencies, the Massachusetts Bay Transit Agency (MBTA) and Rhode Island Public Transit Authority (RIPTA), as well as the fleet of school buses running in both states. Our calculations indicate that, similar to cars, per-mile GHG reductions for transit and school buses plugging into the current grid are between 69% and 75% (these values are adjusted for reduced battery range in wintertime and shoulder seasons). When applied to the existing bus fleets, we get annual GHG emission reductions totaling ~202,500 metric tons of CO2e (you can think of this number as annual GHG emissions avoided by switching these vehicles to electric).*
| Fleet | Number of Vehicles | Annual GHG Reduction (MT CO2e) |
| MBTA diesel | 500 | 33,750 |
| MBTA diesel hybrid | 285 | 14,108 |
| MBTA CNG | 175 | 8,570 |
| RIPTA diesel | 160 | 10,800 |
| RIPTA diesel hybrid | 62 | 3,069 |
| RIPTA paratransit | 112 | 1,371 |
| MA diesel school | 9,000 | 110,190 |
| RI diesel school | 1,690 | 20,690 |
*These calculations are based on the average vehicle mileage reported by U.S. federal agencies. The fleet inventories are compiled using publicly available sources reflecting the 2018 inventory for school bus fleets and 2019-20 inventory for transit fleets. The GHG calculations are performed with the Environmental Protection Agency (EPA) GHG Emission Calculator.
Based on the GHG inventory published in our previous bus blog, the complete electrification of the Massachusetts Regional Transit Authority (RTA) fleets would cut GHG by another ~55,000 metric tons of CO2e per year in the Commonwealth. Taken all together, the total fuel GHG reduction resulting from the full conversion of all public transit and school bus fleets in both states would amount to ~257,500 metric tons CO2e.
But what does this number mean?
As per EPA, 257,500 metric tons of CO2e equate to the contribution of ~55,500 cars, or to the GHG emissions avoided by ~55 wind turbines.
.png?width=630&name=GHG%20Equivalencies%20were%20calculated%20with%20the%20EPA%20GHG%20Equivalency%20Calculator%20tool%20(available%20at%20https___www.epa.gov_energy_greenhouse-gas-equivalencies-calculator).png)
While these numbers are significant, transit and school buses only contribute to a small fraction of the two states’ GHG budget (less than 0.5% in each state). However, eliminating these emissions is relevant for local air quality, and in Massachusetts, necessary to comply with the state’s 2050 decarbonization and climate targets set by the Global Warming Solution Act (GWSA).
Further, bus electrification is cost-effective on a lifecycle basis. A recent study by Applied Economics Clinic has compiled a Marginal Abatement Curve (MAC) using the GHG emission reduction potentials of various carbon reduction strategies that are needed to stay on track with the GWSA. The graph below shows various measures to reduce GHG emissions ordered from least to most expensive, from left to right. Bus electrification (as previously published in the 2018 Carbon Free Boston study) leads to small GHG reductions compared to the state’s CO2e budget (x axis), but it comes with savings (in 2030 dollars) of $426 per MT of CO2e eliminated (y axis).
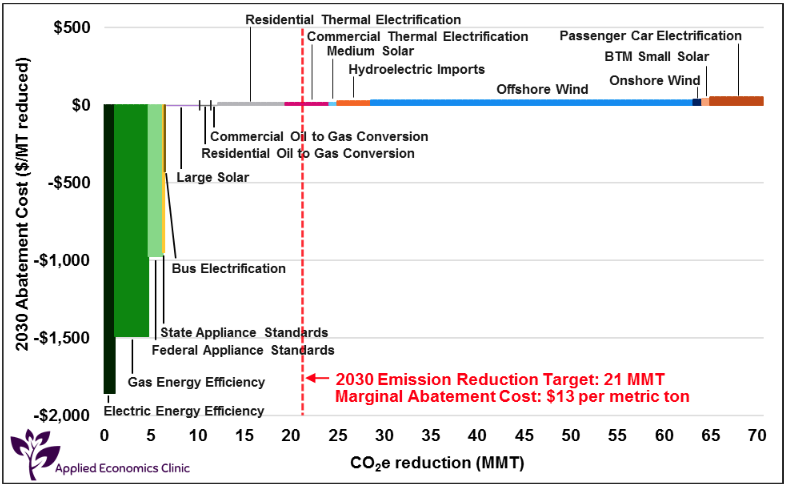
Marginal Abatement Curve (MAC) for Massachusetts, indicating the cost of measures needed by 2030 to stay on track with the Global Warming Solution Act (GWSA) reduction targets. Costs are per metric ton (MT) of CO2e.
These dollar figures do not include indirect electrification costs, such as the cost of upgrading bus depots and charging infrastructure. They also exclude important co-benefits, including avoided health costs, and those can be substantial. For example, the Chicago Transit Authority (CTA) reported annual fuel and maintenance savings mounting to about $25,000 per electric bus, and pollution reduction equivalent to $55,000 in health cost savings.
Who is Committed to 100% Electric Bus Fleets by 2040?
The table below summarizes the electrification targets of major U.S. cities with transit agencies operating large fleets, along with the number of electric buses in service or already ordered. As of today, California is the state with the largest electric bus fleet and the most comprehensive legislative mandate for fleet electrification. However, earlier this year New Jersey Governor Murphy signed landmark legislation to boost electric vehicle adoption and to direct the Department of Environmental Protection and the Board of Public Utilities to establish goals for electrifying medium- and heavy-duty vehicles, with a strong focus on deployment in environmental justice communities. According to this law, NJ Transit will move toward zero emission bus purchases by 2032.
| Fleet Size | Electric Buses In Service / Ordered / On Order | Electrification Target | |
|
California - Los Angeles - San Francisco |
~ 15,000 ~ 2,500 ~ 1,000 |
200 operating in the state |
100% by 2040 100% by 2030 100% by 2035 |
| New York City | ~ 5,800 | 10 (of 60 on order) | 100% by 2040 |
| Toronto | ~ 2,000 | ~ 15 (of 60 on order) | 100% by 2040 |
| Chicago | ~ 1,800 | 2 (of 20 on order) | 100% by 2040 |
| Seattle | ~ 1,550 | 10 (of 120 on order) | 100% by 2040 |
| Philadelphia | ~ 1,400 | 25 operating | Tentative 100% by 2040 |
| Minneapolis | ~ 1,000 | 6 (of 125 on order) | 100% by 2040 |
| Miami | ~ 800 | 33 ordered | 50% by 2035 |
| Portland (Oregon) | ~ 650 | 5 (of up to 80 on order) | 100% by 2040 |
Massachusetts and Rhode Island also operate electric transit buses and school buses. In the Commonwealth, the MBTA is operating five articulated 60-foot electric buses on the Silver Line, while several RTAs are operating a total of 15 40-foot buses – with more procurements scheduled for 2020-2021. In Rhode Island, RIPTA is operating 3 units, with plans for more in 2021. Massachusetts also has 3 electric school buses. However, neither state has full fleet electrification goals mandated by the legislature, and no set timelines.
%20(1).png?width=630&name=GHG%20Equivalencies%20were%20calculated%20with%20the%20EPA%20GHG%20Equivalency%20Calculator%20tool%20(available%20at%20https___www.epa.gov_energy_greenhouse-gas-equivalencies-calculator)%20(1).png) Electric buses on the road in Worcester (left) and Providence (right)
Electric buses on the road in Worcester (left) and Providence (right)
In Massachusetts, we support S.2498, ‘An Act to accelerate the transition of cars, trucks and buses to carbon-free power’, which would require the purchase of zero-emission transit buses starting in 2030. It would also require that the MBTA "develop and complete a plan to operate exclusively zero-emission passenger buses not later than December 31, 2040," while prioritizing their deployment in under-served communities and areas with a high percentage of low-income households.
These provisions are important to make progress on both public health and environmental justice. The latest research emerging during the COVID-19 pandemic has only reinforced the notion that even small levels of air pollution damage public health substantially, and further exacerbate the vulnerabilities of disadvantaged populations. We need cleaner air after this pandemic and starting with buses is a reasonable thing to do.
Donate today to support our work advocating for better public policy and increasing adoption of electric buses.

Comments