

This summer, we’ve been tracking peak demand, peak temperatures, and prices with help from the data collected by ISO New England (ISO-NE), the grid operator for our region. We monitored energy trends on a daily basis to provide insights to our Shave the Peak subscribers.
| Not signed up for our Shave the Peak alerts yet? There’s always next year! Enroll here to receive timely updates about when to strategically reduce your energy use next summer. If you read our midsummer Shave the Peak report, some of this information might look familiar, but be sure to stay tuned for new summer 2026 insights. |
Why Shave the Peak?
Daily peak demand generally occurs on weekdays between 4:00 - 8:00 PM, when people on a 9-to-5 work schedule get home and often turn on the lights, cook, watch TV, or run a load of laundry. On most days, this level of demand is manageable, but during the summer, things get complicated.
In New England, weather is the primary driver of energy demand, especially during the summer months when people must run their inefficient air conditioning units to stay cool. On particularly hot days, this can lead to peak demand events where the grid operator must call on more power generators than normal to satisfy demand. These additional generators are called peaker plants. Peaker plants are old fossil fuel power plants that are incredibly inefficient and expensive to operate. This means that days with especially high peak demand often lead to higher energy prices and more pollution than typical days.
The Shave the Peak program is our way of addressing peak demand by harnessing the power of collective consumer action. All throughout the summer, we monitor forecasted energy demand, and when a particularly hot or humid day rolls around and creates the conditions for a peak demand event, we send out a text to our subscribers notifying them ahead of time. By delaying energy-intensive activities like laundry, running the dishwasher, or charging your electric vehicle if you have one, we can avoid contributing to the severity of that day’s peak.
Summer 2026 Trends
We tracked a couple of components of the energy system this summer, as did ISO-NE. Our analysis focused on the relationships that peak demand has with both temperature and energy prices. First, we’ll look at temperature. The graphs below show the relationship between daily peak temperature and daily peak energy demand for the months of June, July, and August.
June: A Cool Start To Summer
Peak Temperature vs. Peak Demand in June 2026
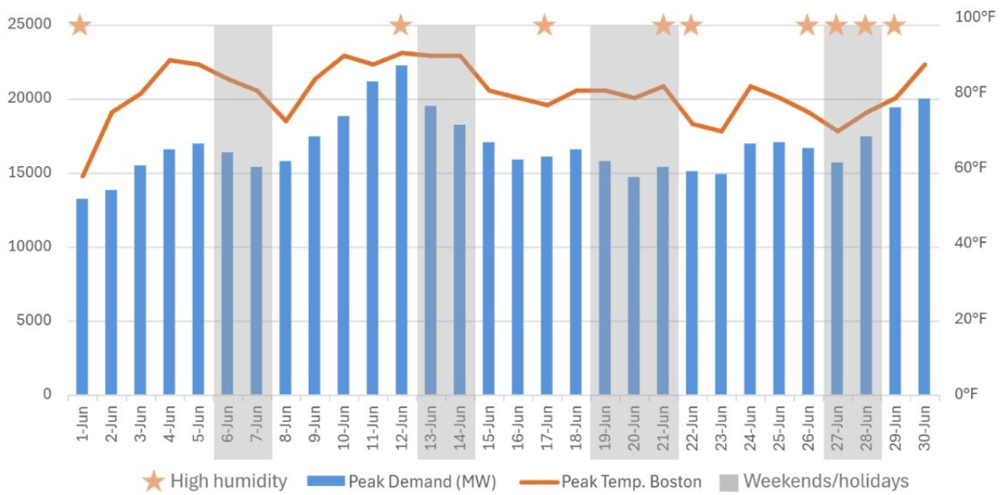
The month of June was relatively cool, with an average peak temperature of 80 degrees. ISO-NE found that the average peak demand and average electricity use were both lower in June 2026 than in June 2025 due to cooler average temperatures in the region. Because of this, people didn’t use as much air conditioning, therefore creating lower-than-usual demand.
Note: weekends and holidays are greyed out because peak demand is generally lower on days when most people are not on the same 9:00 AM - 5:00 PM schedule.
July: Holiday Heat Wave Drove This Year’s Highest Energy Demand
Peak Temperature vs. Peak Demand in July 2026
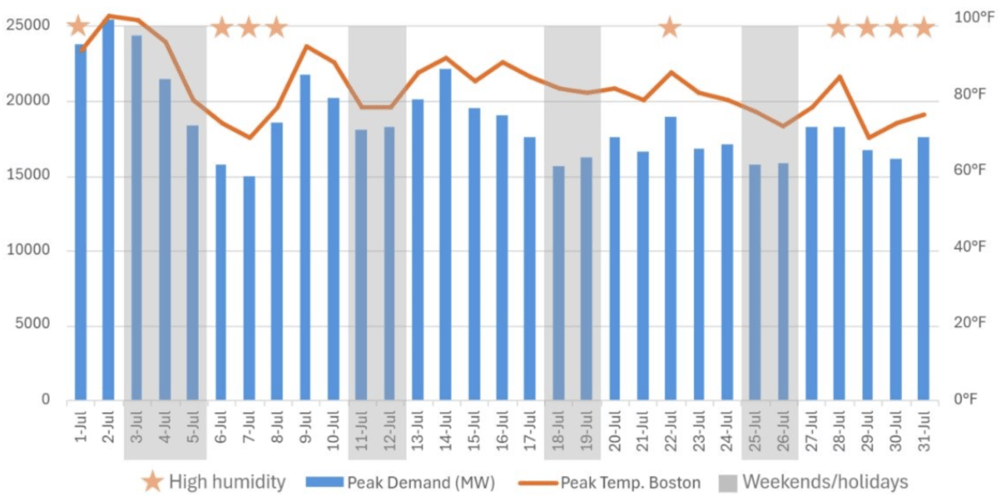
The graph for July shows the clearest relationship between daily temperature and peak demand. The heat wave around the Fourth of July weekend caused the highest peak demand we saw all summer, reaching 24,450 MW. Still, ISO-NE reported that electricity use was 6.1% lower than July 2025, largely because temperatures were cooler on average.
August: Humidity Plays a Role
Peak Temperature vs. Peak Demand in August 2026
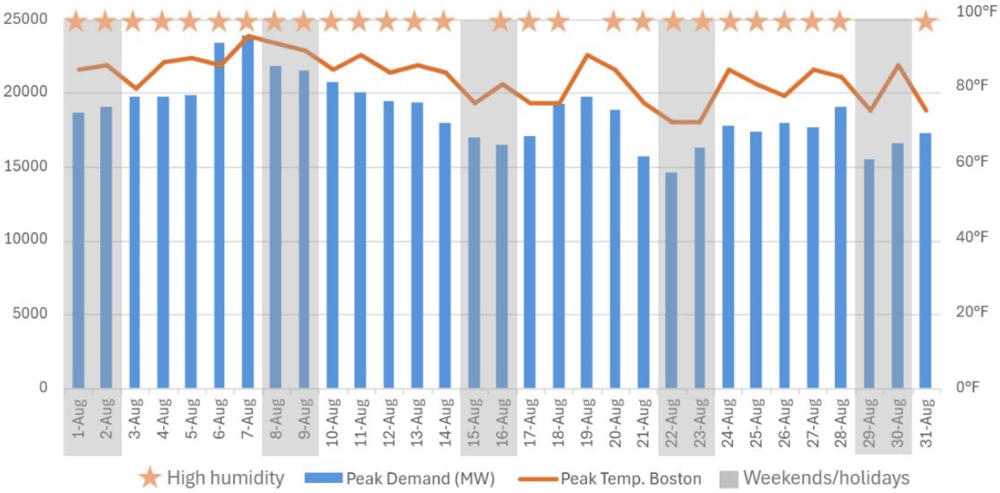
Below, the graph for August demonstrates how humidity, not just base temperature, plays a role in peak demand. August 6 is the only day on all three of these graphs where demand is noticeably above the temperature line. This is due to the particularly high humidity on that day, causing people to use even more electricity than the day before, even though August 5 had a slightly warmer base temperature.
Locational Marginal Prices
Now, let’s talk about energy prices. Locational Marginal Prices (LMPs) are essentially the wholesale price of electricity at different points on the grid. They reflect the cost of available energy supply, congestion on that section of the grid, and the physical loss of electricity as it travels over transmission wires.
One of our program associates, Suriya Selvakumar, tracked weekly LMPs and compared them to last year’s data. He found that this summer, weekly LMP prices were much more stable than last year. Note in the graph below that the highest on-peak spikes are consistent with the peak demand graphs discussed earlier.
2026 NEMA LMPs (May - September)
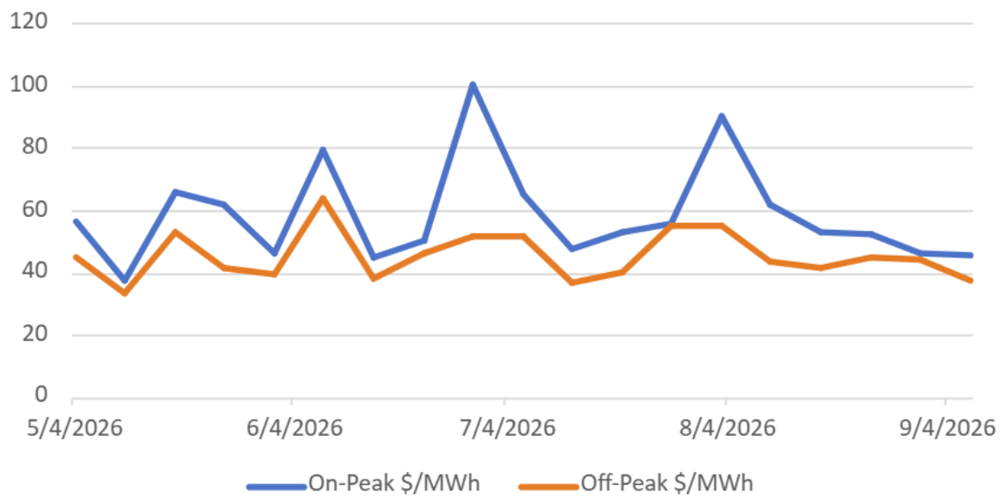
This graph shows the Locational Marginal Prices (LMPs) for the Northeastern/Boston load zone (NEMA) from the months of May to September. The lines show how the cost to generate electricity in this load zone, both the peak and off-peak prices, change over the course of the summer season.
Resource Mix & Emissions
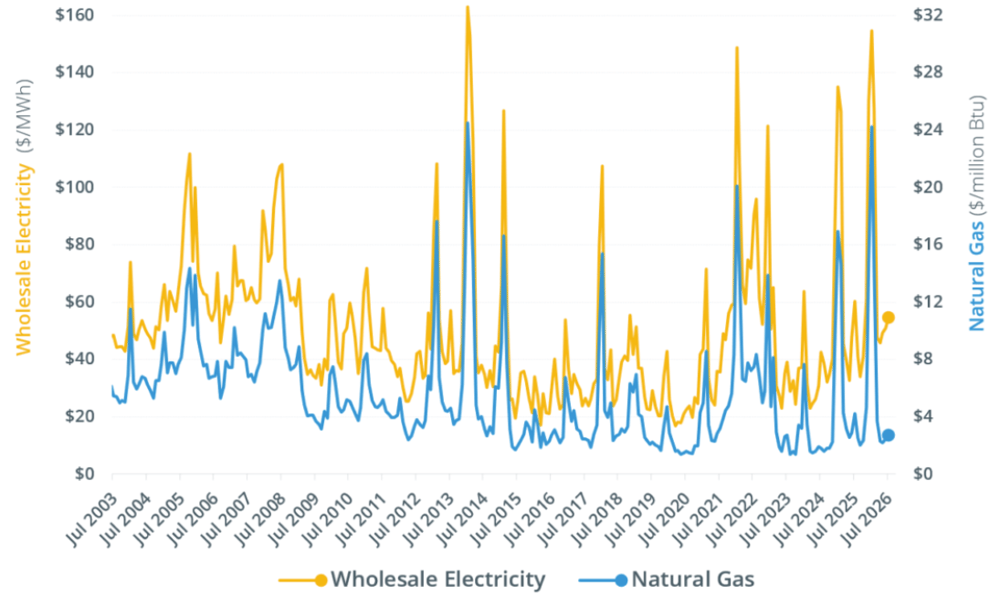
We mentioned that one component of LMPs is the cost of available energy supply to the grid, also known as wholesale electricity prices. Wholesale prices are closely linked to fossil fuel prices. Wholesale prices are determined by the most expensive generator required to satisfy the level of demand on the grid. Because many renewable resources have very low operating costs, they are often dispatched before more expensive fossil-fuel generation. Natural gas-fired generators almost always set the wholesale electricity price in New England. The graph below charts wholesale prices and natural gas prices from July 2003 through 2026.
ISO New England tracks changes in electricity use and emissions from fossil fuel generators on a monthly basis, and this year they found that between May and July, there was a significant decrease in the use of oil when compared to the same time period in 2025. They also estimated a 19% decrease in CO2 emissions from New England power plants in July 2026 compared to July 2025, as detailed in the chart below.
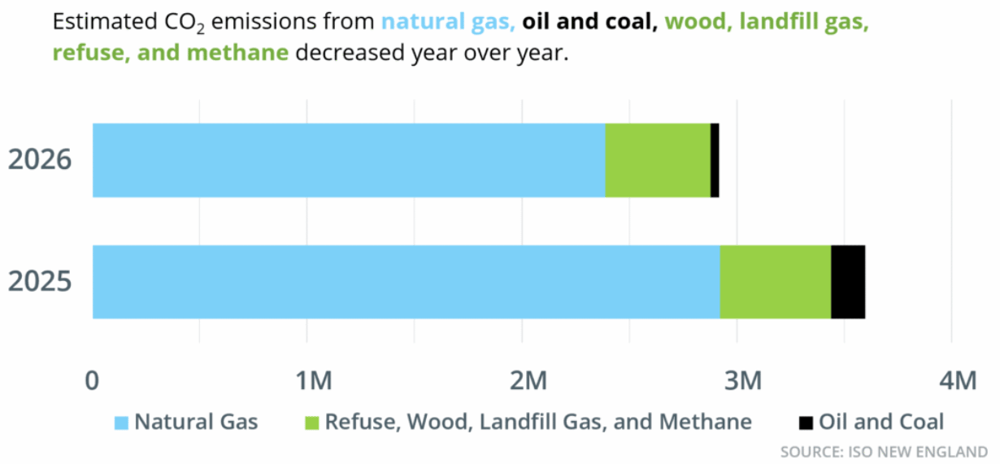
July 2025 and 2026 estimated CO2 emissions in New England, by fuel source (metric tons). Source: ISO New England
While this is a positive trend that we’re happy to share, it should be noted that the emissions from fossil fuel use this summer were still considerable. Programs like Shave the Peak and Connected Solutions—administered by utilities like Eversource, National Grid, and Rhode Island Energy—give energy consumers an opportunity to maximize their impact by minimizing their energy use.
Behind-the-Meter Solar
If you read our mid-season Shave the Peak blog from August, you might remember that the highest peak that month was July 2 during a massive heat wave. Thankfully, we didn’t experience another day like that this summer, so the highest peak this year was 24,450 MW of demand on July 2.
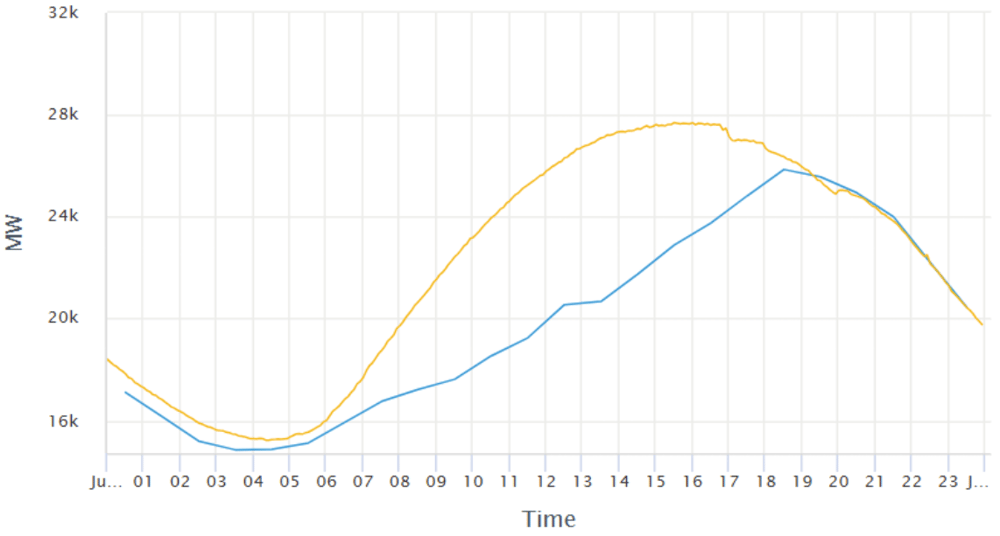
The blue line on the graph above shows the demand for electricity from the grid on July 2. The yellow line shows the actual demand that day, including how much of that demand was satisfied by behind-the-meter (BTM) solar. BTM solar is non-utility-scale solar, like a rooftop or other installations.
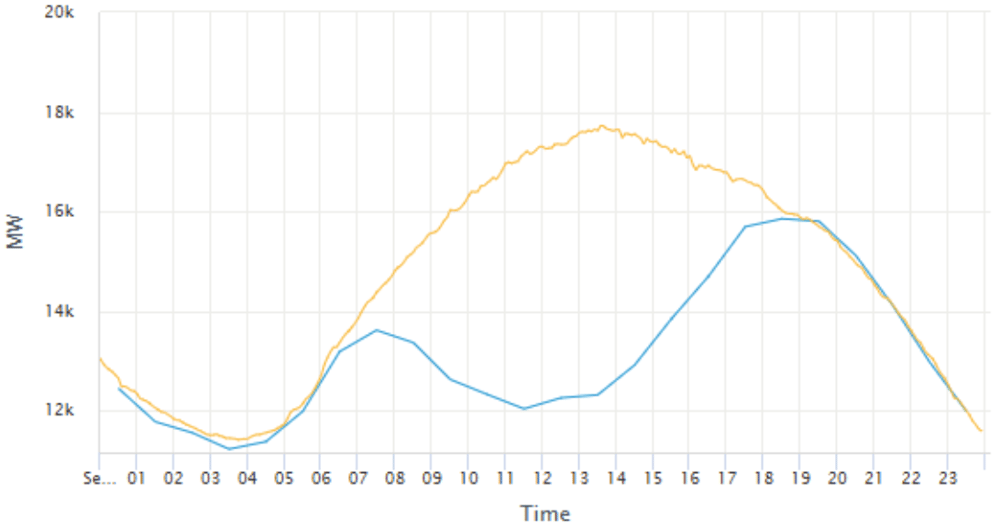
To give you an example of the impact of BTM on a non-peak day, the above graph from September 18 shows that BTM solar covered so much energy demand during the middle of the day that there was a downward trend in demand for electricity from the grid. This phenomenon is called the “duck curve” because, in extreme cases, it can make a demand graph look like the silhouette of a duck (the low point being the belly and the high point being the head). This is another reason that when we use electricity matters.
Shave the Peak Round-Up
Overall, we only called five Shave the Peak events this summer. Some of these were for a single day, while others alerted our subscribers to a series of peak days during a heatwave:
-
May 19
-
June 11
-
July 1 (heatwave)
-
July 14 (heatwave)
-
August 6
Participants in the Connected Solutions programs in Massachusetts and Rhode Island receive alerts more often, even multiple times a week, but they are compensated for their involvement. If you have a smart thermostat or battery storage system, consider enrolling in Connected Solutions to earn money with your smart device.
With that, we conclude the 2026 Shave the Peak season. We look forward to checking back in with you next summer. If you’re already a subscriber, thank you! If not, sign up here for next season—it looks like it’s going to be a hot one.
Comments