

The beginning of July marked record-breaking heat in Boston and Providence. These temperatures caused electricity demand to surge—known as peak demand events—as people ran their air conditioners to stay cool.
Peak demand events lead to an increase in both electricity prices and pollution due to the need to turn on more expensive and polluting power plants to meet electricity demand. To combat this, demand response initiatives like our Shave the Peak program and ConnectedSolutions (a program administered by Electric Distribution Companies in Rhode Island and Massachussetts) allow residents to stay informed and reduce their own electric use during peak hours.
What is peak demand, and why does it matter?
Peak demand happens when energy consumption is at its highest. On a daily basis, this usually happens between 5:00 PM and 8:00 PM when people get home from work and start turning on lights, running a load of laundry, and cooking dinner. As the weather gets hotter, people also turn on their air conditioning. Since air conditioning is very energy-intensive, hot summer days often lead to higher peak demand than usual.
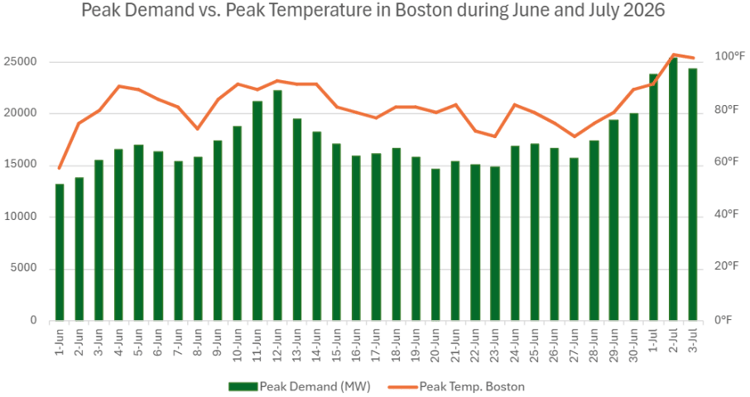
The graph above demonstrates the relationship between daily peak demand and peak temperature. For instance, on Thursday, June 25, the high was 80°F, and peak demand was a manageable 17,000 megawatts (MW). One week later, on July 2, temperatures in Boston reached 100°F (a historical record for that day) and peak demand hit 24,450 MW. Let’s take a closer look at the grid conditions on those days and compare the effects of a typical day and a peak day.
The following graphs document the mix of fuels that the grid operator, ISO-New England, called upon to meet demand on June 25, a typical summer day with moderate temperatures, and July 2, a peak summer day with extreme heat.
Resource Mix on June 25, 2026:
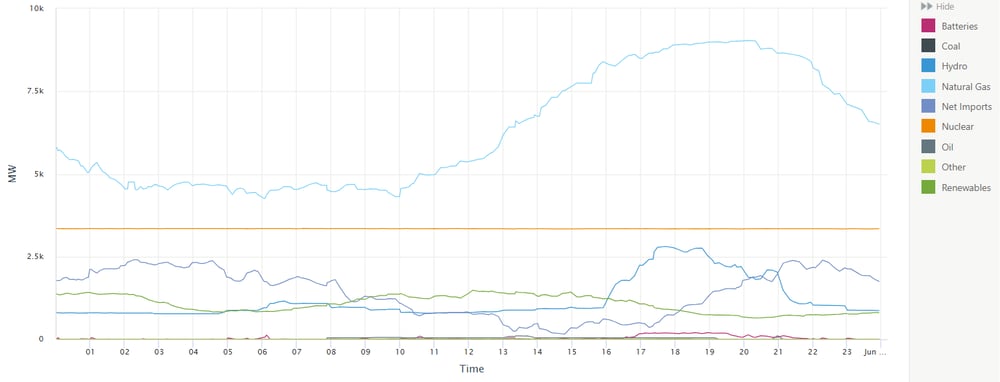
Natural gas supplied the vast majority of energy on both days. Other sources included nuclear, hydro, renewables (solar, wind, refuse, wood, and landfill gas in this case), and batteries, which ISO-New England incorporated in their tracking earlier this year.
The straight orange line represents nuclear power, and it’s a helpful reference point for comparing these two graphs because nuclear contributed the same amount of energy to the grid on both days. This puts into perspective the massive amount of natural gas deployed on July 2.
Resource Mix on July 2, 2026:
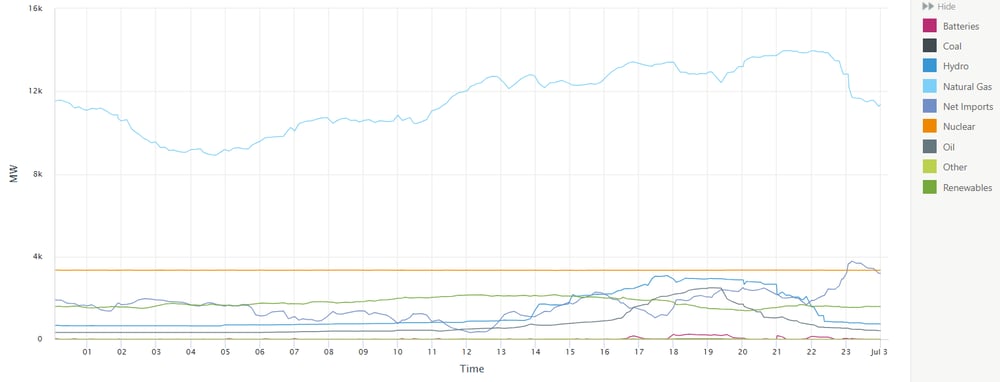
Another troubling aspect of the July 2 graph is the dark gray line representing oil (not to be confused with the slightly lighter line for net imports, which peaked at 11:00 PM). Oil reached a total of 2,490 MW supplied to the grid around 7:00 PM, compared to 46 MW of oil at that same time on June 25.
This highlights the importance of increasing the capacity of solar and batteries to maximize the power of renewable energy and shaving the peak to reduce the use of expensive and polluting fossil fuels.
CO2 emissions on June 25, 2026:
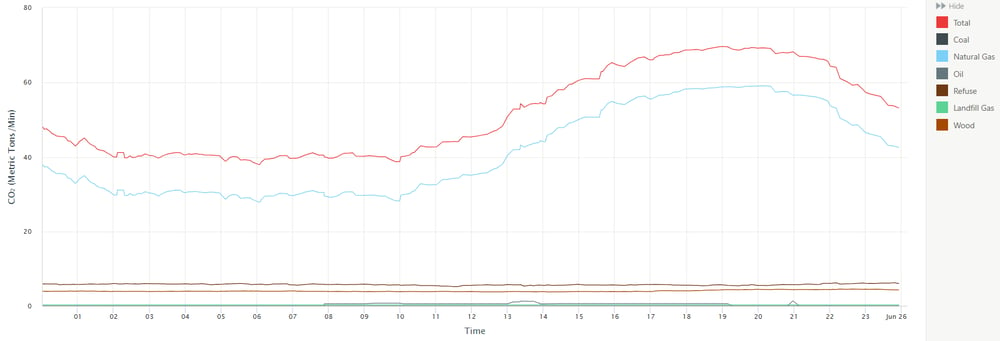
Notice that the high end of the CO2 scale on July 2 is 160 metric tons per minute—twice as high as it was on June 25. The use of oil to meet peak demand on July 2 was a major reason for that increase in emissions.
CO2 emissions on July 2, 2026:
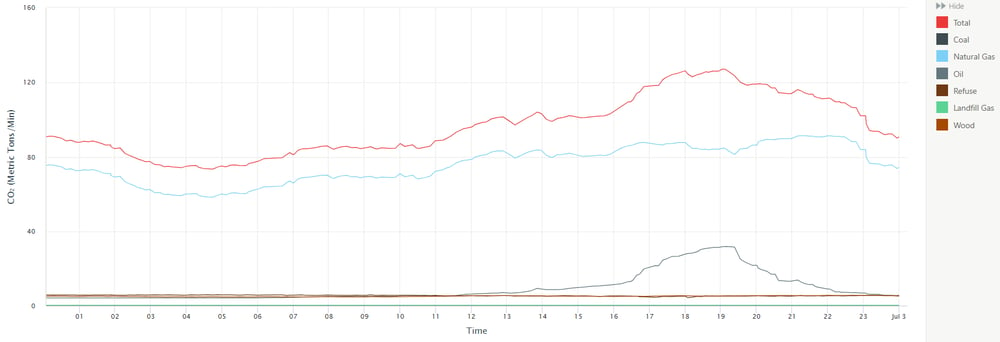
The increase in oil and natural gas use on June 2 also led to higher electricity prices. ISO New England reported that during the height of demand on June 25, electricity was $80.83/MW. In comparison, electricity was a staggering $292.57/MW during the much higher peak on June 2. Demand response, therefore, is more than just a public service; it’s a device to bring down the price of electricity across the entire grid.
The Duck Curve
Our main tools to avoid the use of expensive and polluting fossil fuel peaker plants are to shave the peak (reduce the amount of energy we use) and to use more renewable energy. This is where the dynamic duo of solar power and battery storage come in.
.png?width=1000&height=269&name=Untitled%20design%20(51).png) The graph on the left above shows, in light yellow, the contributions of rooftop solar systems that are not controlled or dispatched by the grid operator. This is referred to as “behind the meter” (BTM) solar.
The graph on the left above shows, in light yellow, the contributions of rooftop solar systems that are not controlled or dispatched by the grid operator. This is referred to as “behind the meter” (BTM) solar.
As you can imagine, solar power production is highest during the day, especially when it’s sunny. This means that with more solar panels—both BTM residential and utility-scale—the grid operator needs to call up fewer fossil fuels to meet demand during daylight hours.
Displacing midday demand creates an effect called the "duck curve," where demand rises in the morning as people wake up, then falls during the day as rooftop solar systems kick in and rises again in the evening. This phenomenon was first observed in California, but New England now has enough solar capacity that the ISO reported a total of 134 ‘duck curve days’ in 2025.
The Acadia Center conducted an in-depth analysis of the grid impacts of the heat wave over the Fourth of July weekend and found that energy market savings driven by distributed solar on July 2 alone totaled $39-54 million.
However, as discussed, peak demand generally hits around 7:00 PM when the sun sets. So, how do we extend solar's demand-reducing power into the evening hours? The answer is battery storage. Batteries can store some of the energy produced by solar panels during the day and discharge it to individual homes or the grid in the evening. This is one way to shave the peak, but you don’t need a battery or solar panels to do your part.
Everyone can play a role.
Consider signing up for our Shave the Peak program to receive text and email alerts on peak days with information on individual actions that can help reduce overall electricity usage during peak demand hours.
Shave the Peak alerts often recommend saving energy during a specific timeframe, usually 5:00 PM to 8:00 PM, depending on the day’s specific conditions. The 6:00 PM to 8:00 PM period is typically the highest peak. If we see through our data monitoring that a peak day is likely to occur on a particular day or two, we’ll let participants know to be mindful of their energy use for the upcoming days, rather than sending a notification for each day.
Here are practical ways to "shave the peak" during those specific hours:
-
Pre-cooling works! Concentrate your AC usage on a couple of rooms and get them nice and cool before 5:00 PM. Then, turn the AC up a few degrees, or even turn it off if you can.
-
Use fans wherever possible to compensate for AC and draw the blinds to help keep rooms cool. If you're planning an outing to the pool or to the air-conditioned library or mall, do it during peak hours!
-
Don’t do the laundry. When you do, wash in cold water.
-
Don’t run the dishwasher.
-
If you have an electric car, schedule your charging session for 9:00 PM to 7:00 AM. Avoid peak times!
-
Sign up for Shave the Peak to get reminders to reduce your electricity use when it matters most.
Get Paid to Lower Peak Demand with ConnectedSolutions
ConnectedSolutions is a program administered by Mass Save (Eversource, National Grid, Unitil) and Rhode Island Energy to reduce demand on the electric grid by having households or businesses with qualified smart thermostats or home battery storage systems enroll their device(s) in the program and collectively participate in reducing energy demand on the grid through a “Bring Your Own Device” (BYOD) model.
When peak demand is predicted to occur, the utility calls a ‘peak event,’ which is when all devices enrolled in ConnectedSolutions are called upon to reduce demand on the grid in one of the following ways:
-
All smart thermostats enrolled are sent a signal to adjust the temperature of the thermostat by a few degrees;
-
All battery systems enrolled in the program are called upon to discharge the energy stored in the battery to supplement the grid’s existing energy supply.
Whether you have a device to enroll in ConnectedSolutions, or you sign up for Shave the Peak to stay informed, everyone can play a role in reducing peak demand this summer.
This week, we have two peak events coming up on Thursday, August 6 and Friday, August 7. If you haven’t already, sign up for our Shave the Peak text alerts for a reminder to reduce your electric use on those days!
Comments