We often get questions along the lines of: "should I get an electric car now, or should I wait until my current car *really* gives up the ghost?" Well, one of our EV Ambassadors, Xavier, recently grappled with this question himself and kindly offered the following blog post to us! The below is all his text, with some additions (in italics) from us here at Green Energy Consumers.
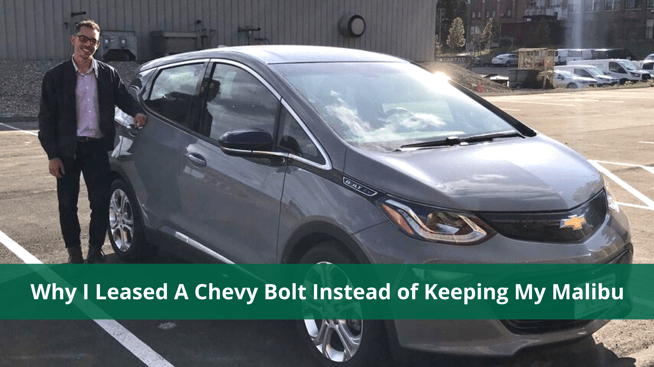
Last year, due to a series of transmission issues, my 2011 Chevy Malibu was totaled and it was time to make a decision that many of us are all too familiar with: keep pouring more and more money into a car that is falling apart, or look into investing in a new one. Either way, I knew I needed something that would last for at least the next three years and that I cared more about getting from A to B reliably than looking flashy while doing so. Overall it seemed like a wash financially, but the real tipping point for me was the potential of buying an electric vehicle (EV). After researching the options, looking at the current state of cars on the market, incentives, logistics, and my own personal needs, I decided on leasing a 2020 Chevy Bolt. Here’s how it shook out.
Charging Logistics
First, the circumstance of living in an apartment made the idea of owning an EV a bit awkward. How and where am I supposed to charge it? After some research, I learned that charging stations come in three different flavors:
- Level 1: Standard 120V wall outlet (1kW) - this will charge about 5-6 miles per hour.
- Level 2: Typical charging station found in parking lots, homes, and garages (3-20kW, typically 6kW) - this will charge 20-25 miles per hour.
- Level 3: DC fast charge (typically 50kw, occasionally 20kW) - around 100 miles per hour.
(Note from Green Energy Consumers here: Check out our Charging page for more information on these different charging levels.)
With a quick search on Google Maps, I found that there were already a few charging stations around in town in Northampton: at the fire station, the People’s Bank next door to my gym, and next to Bombay Royale, which is just a five minute walk from my apartment. Doing the math, I could charge for 2 hours while at the gym, picking up 40 miles of charge in the process. Do this three times per week and that covers my commute to work, which is about 11 miles each way. I could also charge while I’m grabbing groceries at Big Y and pick up some miles there. In a pinch, I learned that I could use a DC Fast Charger (Level 3) at the Home Depot nearby my work. Overall, with some care, this style of guerrilla charging seemed feasible. (If you're in a similar boat and want to check out what charging is available near you, we recommend PlugShare as a great place to start!)
Charging Costs
It’s one thing to be able to charge, but how do the economics work? Unlike traditional fuel, where gas prices are pretty much consistent from station to station save for a few percentage points, charging costs vary greatly from station to station. (It's worth noting that, over time, electricity costs are more stable than gas prices though.) Every charging station will have its own rates, whether it’s Chargepoint, EVGo, Electrify America, etc. I’ve found that most level 2 charging stations just charge by kilowatt-hour (kWh, or amount of electricity used). When it comes to level 3 (DC Fast) charging stations, the ones I’ve used have an upfront cost (“session fee”), and then charge by time rather than kWh.
For example, I used a DC Fast charger in Chicopee last fall, and charged my car from 8% to 72% in 56 minutes. I was charged a $1.00 session fee + $0.21/min of charge time + 6.25% sales tax, totaling $13.69.
Looking at level 2 chargers, the rates are simpler, but it seems to be location dependent. For example, I charge for free in Northampton, and have charged for free in Somerville. However, when I charge in Amherst I’ve always had to pay, and the rate has been around $0.20/kWh. It is unclear why Northampton is free while Amherst is not, and I’ve had trouble finding documentation that offers any clarity. (A note from Green Energy Consumers again here: We highly recommend the crowd-sourced resource PlugShare, where EV charging is located and at what cost. Ultimately each site host decides how much or if to charge.) In my opinion, this information needs to be more readily available to consumers so that they know how their town manages charging infrastructure.
To highlight the difference in fuel costs between what I paid with my Chevy Malibu vs the Bolt, I took a look at the past six months. On average I was fueling up about three times a month with the Malibu. Looking at my transaction history for the first 6 months of 2019, I paid $601 on gas.
Luckily, the charging stations have mobile apps so I can easily tally up that number by looking at charging history. From August 25 to February 25, the tally goes as follows:
|
Charging History from 8/25/19 to 2/25/20
|
|
Charging Station Provider
|
Type of Station
|
Location
|
Number of Sessions
|
Cost
|
|
Chargepoint
|
Level 2
|
Northampton/ Amherst
|
80
|
$18.42
|
|
EVGo
|
Level 3 DC Fast
|
I-90 Highway
|
2
|
$17.66
|
|
Electrify America
|
Level 3 DC Fast
|
Chicopee Marketplace
|
12
|
$90.20
|
|
TOTAL
|
|
|
94
|
$126.28
|
This tally represents a real expectation of charging costs, showing the lion-share coming from regular charging sessions, but also displaying those expensive level 3’s I had to use whenever I was in a pinch. Extrapolating this over the course of a year, there is $950 in savings between using an EV in this type of “guerrilla” charging and a traditional car running on gas.
So yes, while it is inconvenient to charge outside my home, because Northampton has free charging stations, I actually saved quite a bit more money than I would have otherwise. But that is a coincidental consolation. For everyone to do this, it is not sustainable. The EV driver who cannot charge at home is at a disadvantage over other EV drivers. Understandably, someone in that situation might give up and keep driving gasoline. This problem is holding back electric car adoption, especially in areas with a high percentage of multi-unit dwelling occupants.There needs to be more public stations as well as an incentive for landlords to install them and/or overhaul their outdated infrastructure. (Green Energy Consumers again: The good news is that we are on our way. Both Eversource and National Grid have “Make Ready” plans in place where they can pay for part of the cost of installation of EV charging at multi-unit dwellings, workplaces, and public sites.)
Tax credits & rebates
I was able to take advantage of both the federal tax credit and the state rebate to help lease my Bolt. The federal tax credit isn’t straightforward, and then each state has its own provisions on top of it.
At the time I leased the car, there was a $3,750 Federal Tax credit available for Chevy Bolts. Then the state of Massachusetts had a program called “Massachusetts Offers Rebates for Electric Vehicles (MOR-EV)” which offered a $1,500 rebate. This rebate ended up covering most of my down payment for the car.
Now, things have changed a bit. The federal tax credit for Chevy Bolts was in the midst of being phased out, and as of April 1st, 2020, is phased out completely (Tesla vehicles have already been phased out). This credit is vehicle-dependent, and there are plenty of credits available for other EVs. Basically, once a manufacturer has made enough cars to pass a certain threshold, the credits begin to phase out. A summary of tax credits pertaining to EV’s are listed here. (A note from Green Energy Consumers: The federal tax credit phases out once the manufacturer has sold 200,000 EVs. For more information, check out our incentives page.)
Every state is different, but for Massachusetts, the MOR-EV program seems to have expanded. It is now a $2,500 rebate for EVs and $1,500 for plug-in hybrids under $50,000. The support MA has doesn’t end at rebates for purchasing EV’s. There are also grants for public fleets, EV infrastructure, and workplace EV supply equipment. For more information, see here.
Total Cost Comparison
It’s hard to say exactly how much I would end up paying in things like maintenance and repairs for my Chevy Malibu as it was entering its 9th, 10th and 11th years. I knew I was going to pay at least $1,500 to get the transmission back up and running. To get a better idea, Edmunds has a “True Cost to Own” estimator that lists these types of costs over the first 5 years of ownership.
Using this data, I projected those numbers forward, estimating that I would be paying on average $3,046 per year in maintenance and repairs, from years 9 to 11. This number seems pretty high, so for the sake of this discussion let's assume that the transmission replacement isn’t uncommon around this time (~100k+ miles), and it is factored into these costs.
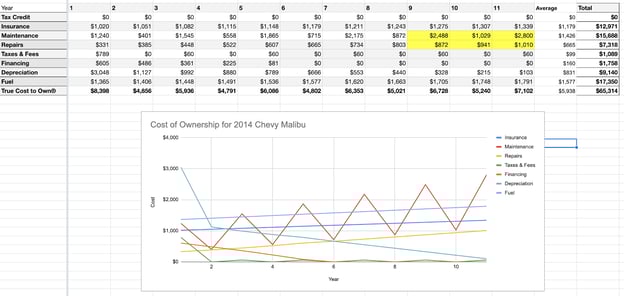
Adding these costs to the fuel costs above, I would be paying $12,744 in total over the course of 3 years. Of course, this estimate is fluid. I could get lucky and have nothing go wrong and end up paying much less. However, the opposite is also true.
For another estimation of these maintenance costs, AAA has an annual report where they provide cost per mile rates for various vehicle types. For example, for a medium sedan they estimate the maintenance, repairs, and tires to cost 9.18 cents/mile. Certainly a crude method that averages all cars of the same type regardless of things like make and age, but it provides another data point to look at. As my lease for the Bolt is 3 yr/ 30,000 miles, we’ll assume the same number of miles driven for the Malibu in that span, and also assume the transmission costs ($1,500). This puts maintenance and repair costs at $4,254 total over that span, which is much lower than using the Edmunds method.
By contrast, the Chevy Bolt has nearly zero maintenance cost for the first 150,000 miles. AAA does have an estimate for maintenance and repair cost-per-mile for EV’s, which is 6.60 cent per mile. This translates to $1,980 over the span of the 3-year lease.
In summary, we are looking at the following breakdown for total costs over the 3 years:
|
Cost/ Credit
|
2020 Chevy Bolt
(Years 1-3)
|
2011 Chevy Malibu
(Years 9-11)
|
|
Amount Due at Signing*
|
$5,880
|
-
|
|
Scheduled Lease Payment over 36 months
|
$12,106
|
-
|
|
Disposition Fee
|
$395
|
-
|
|
Electricity/ Fuel Costs
|
$758
|
$3,606
|
|
Maintenance & Repairs (Edmunds/ AAA)
|
N/A- $1,980
|
$4,254 - $9,130
|
|
Federal Tax Credit
|
($3750)
|
-
|
|
State EV Rebate
|
($1500)
|
-
|
|
Selling Used Malibu w/ bad transmission
|
($500)
|
-
|
|
Total
|
$13,388 - $15,369
|
$7,860 - $12,736
|
* Includes capitalized cost reduction, title, license, registration fees, admin fees, sticker fees
(Green Energy Consumers again: The federal tax credit has since expired on the Chevy Bolt. For a list of cars that still qualify, check here.)
So my total cost would be the down payment, monthly lease payments, the electricity, and then subtract any tax credits. This ends up being somewhere between $13,888 and $15,869 in total after 3 years. In the end it appears I will have ended up paying more money in the Bolt, but with that comes the peace of mind of not having to worry about my car breaking down. There’s also the benefit of having zero tailpipe emissions.
Carbon Footprint
Let’s take a look at that. The other aspect to this was whether or not this even makes a difference to the environment. A rudimentary way to look at this is the fact that my car is no longer a fossil-fuel burning machine, and that’s a good thing. However, the electricity used to power the car is coming from a grid that isn’t yet 100% clean.
The Union of Concerned Scientists has a tool called the EV Emissions Tool that will show you the emissions of an all-electric vehicle anywhere in the US, based on the electricity mix of the electric grid at that zip code. If you plug in a Northampton zip code and the Chevrolet Bolt, you can see that the Bolt is responsible for only 22% of the emissions of the average gas-powered car. My 2020 Bolt charged in Northampton has the equivalent emissions of a car getting 129 miles per gallon, about 5x the gas mileage of my previous 2011 Malibu.
The UCS tool is a little limited in that it looks at the whole New England grid as one entity, but it still gives you a sense of the scale of emissions reductions. And the good news is that the grid is getting cleaner every year thanks to Massachusetts’ Renewable Energy Portfolio Standard, which mandates a year-over-year increase in renewable content.
On a life-cycle analysis basis, EVs also win out over gas-powered cars. Argonne National Laboratory performed a study on “well-to-wheels” energy use and greenhouse gas emissions of electric vehicles and plug-in hybrids versus conventional vehicles with an internal combustion engine (ICE). Well-to-wheels emissions includes all the emissions related to fuel production, processing, distribution and use. In general, EVs have a larger carbon footprint in manufacturing than gasoline cars, and it gets worse with larger battery sizes. However, this difference is quickly flipped far in the other direction as soon as the car is driven. Shorter range models can offset the extra emissions as soon as 6 months.
If we try to go state-specific, the emissions from electricity production are quite variable from state to state. For states where the majority of electricity is from renewables, the difference between EV and gasoline car emissions is immense. The gap shrinks particularly when it comes to states that rely heavily on coal for example. In 2015, NREL investigated the emissions associated with EV charging, including electricity generation mix, charging infrastructure availability, and vehicle type.
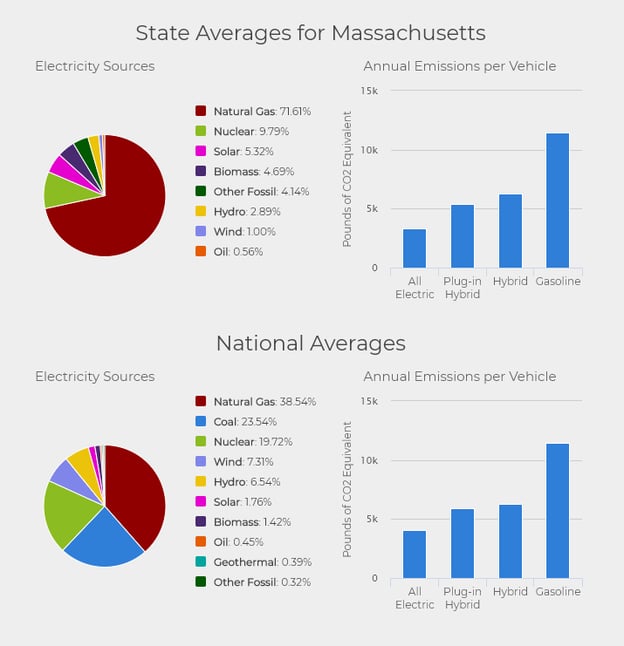
Taking these studies along with others, the alternative fuels data center in the US Department of Energy has a calculator that produces a graphic of each state's entire electricity profile (up to date as of 2019 via the US Energy Information Administration), as well as the comparison between EV’s vs plug-in hybrids vs gasoline cars. According to this, the average all-electric in Massachusetts produces around ⅓ the annual emissions of an average gasoline vehicle (as of 2016). This data agrees pretty well with the results from UCS.
And the Battery?
The batteries on my Chevy Bolt have an 8-year warranty. Over time, the batteries will degrade; generally, you can expect a 2.3% decrease in range per year of driving. They will be fine during the three years of this lease and after 8 years I’ll still have well over 200 miles of range. Generally, you can expect the battery to last the life time of the vehicle.
In most cases, whenever the vehicle reaches end of life, or the batteries cannot provide enough power to propel the vehicle, the batteries can still provide enough power for other applications. As battery storage takes off, retired car batteries can be used to meet the increasing demand for batteries.
To Sum Things Up
- Charging logistics are feasible, but not very convenient if you can’t charge at home. Which is part of the reason why there is a tiny percentage of EV users that charge exclusively using public chargers. With that being said, this should serve as proof that it can be done.
- Charging costs end up being substantially cheaper than gas. Being able to leverage the free stations in my town has cut my fuel costs tremendously. For the majority of EV owners that charge at home, there are still large savings to be had when compared to an ICE vehicle.
- Total cost over the three years ended up being a bit more expensive on the EV side. To put this into context- making the switch to a car 9 years newer, paying up front costs like signing costs, a monthly lease payment, and still coming out relatively close after just 3 years shows the value of an EV. While this case study focused primarily on my own personal situation, there are plenty of studies that compare total cost of ownership between EVs and traditional ICE vehicles over the entire life of the vehicle. These highlight the long term savings in owning an EV.
- EVs have a much lower carbon footprint than traditional ICE cars. About ⅓, depending on the state.
- Federal tax credits vary depending on the car manufacturer. The federal tax credit - and the recently expanded MOR-EV rebate - will help tide the market over until EVs reach cost-parity with gas-powered cars, expected by the mid-2020s.
- From my own personal experience, I see EV’s all over the place nowadays, and the frequency in which I see them has been increasing it seems. It’s promising to see that improved technology, work done with incentives, and greater consumer awareness has culminated in a tangible change.
Comments