This summer, we collected data every day from ISO-New England, the nonprofit Independent System Operator responsible for ensuring reliable electricity delivery across the six New England states. We tracked the forecasted high temperature, the forecasted and actual peak load, the time of said peak, the peak price of electricity and its timing, the CO2 emissions at peak, the output of behind the meter (BTM) solar and its timing, and whether or not we sent out a Shave the Peak notification to our subscribers who receive alerts on when and how to reduce electricity use during times of high stress on the grid. Stay tuned to find out how many Shave the Peak alerts we sent out this summer!
We’ve pulled together some statistics from this past summer (June-August) that highlight how much power demand can vary in the warmer months and how much that demand influences both electricity prices and pollution levels. By sharing these insights, we hope our followers can take these trends and turn them into action and, ultimately… You guessed it, Shave the Peak.
Shave the Peak Alerts
Shave the Peak is our program designed to inform people, via text and email alerts, how and when to reduce power use on days when electricity demand is significantly higher than usual. Summer might be coming to a close, but it’s not too late to subscribe for next season.
“Peaks” on a given summer day refers to the hour when energy demand is highest (for example, 6 PM). Shave the Peak alerts often recommend saving energy during a specific timeframe, usually 4-9 PM, depending on the day’s specific conditions. The 6-8 PM period is almost always the highest peak.
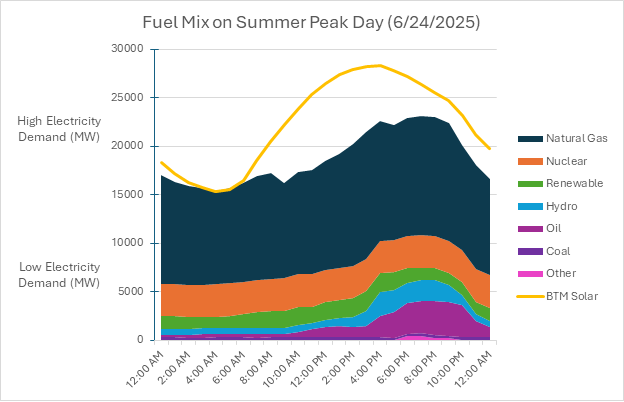
Peak days are a major factor regarding pollution and the cost of our electricity. The two graphs below show the fuel mix on a peak day vs a typical summer day. You’ll notice an increased use of the dirtiest resources, oil and coal, on the peak day. You’ll also notice an increase in BTM solar, which plays an important role in reducing demand on the grid.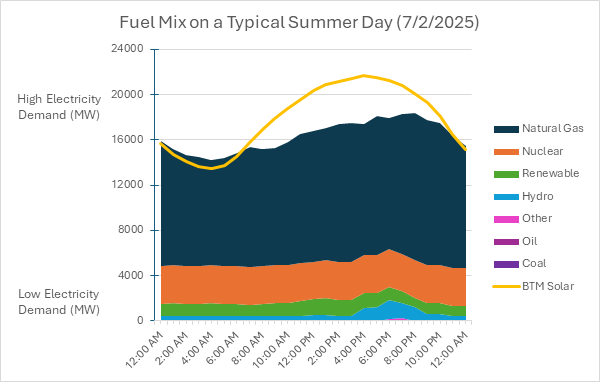
On the occasions when New England’s demand is expected to rise over approximately 22,000 MW, we see that as a time to communicate with subscribers.
2025 Data Trends
Let’s look at the peaks and troughs of this past summer (June through August)!
Hot Days
Temperature is one of the most indicative factors that determines a peak day in the summer. As temperatures rise, people respond by turning on their AC units, which drives up demand. Since the beginning of June, we had seven days reach over 90 degrees. Two of those days were over a weekend, so the peak load, although over 20,000MW, wasn’t as high as expected. The third instance of a 90+ degree day was on a weekday, resulting in a peak load of almost 26,000 MW (we’ll talk in more detail about the importance of weekdays vs. weekends later in this blog). To put things in perspective, the average peak loads are organized below:
|
Type of Day |
Average load (MW) |
|
Every day this summer |
17,918 |
|
Weekdays |
18,463 |
|
Weekend and Holidays |
16,734 |
|
Days above 90 degrees |
23,101 |
Just over 60% of days with temperatures higher than 85 degrees had peak loads over 22,000 MW, affirming that the hottest days produce the highest peaks. To combat the effects of these peaks, we suggest pre-cooling your home before 5 PM and drawing blinds to maintain a cool environment by the time of the peak window (4-9 PM). Within the peak window, turning the AC up a few degrees or turning it off completely are the practices that conserve the most energy. In addition, using fans wherever possible to compensate for AC, spending time in an air-conditioned library or mall, or taking a dip in the pool are additional solutions to staying cool during the peak window.
Timing is Key
When it comes to energy conservation, timing is key. We mentioned how our Shave the Peak program targets the peak window (4-8 PM) because that’s the time when energy demand is highest, but how specific is that timing? This summer, the average time of peak demand was 6:39 PM. The most frequent time of peak demand was 7:00 PM sharp. Adjusting the data for unique outlier days, the earliest time of peak demand this summer was 1:25 PM, and the latest peak demand was 8:45 PM.
Pricing & Emissions
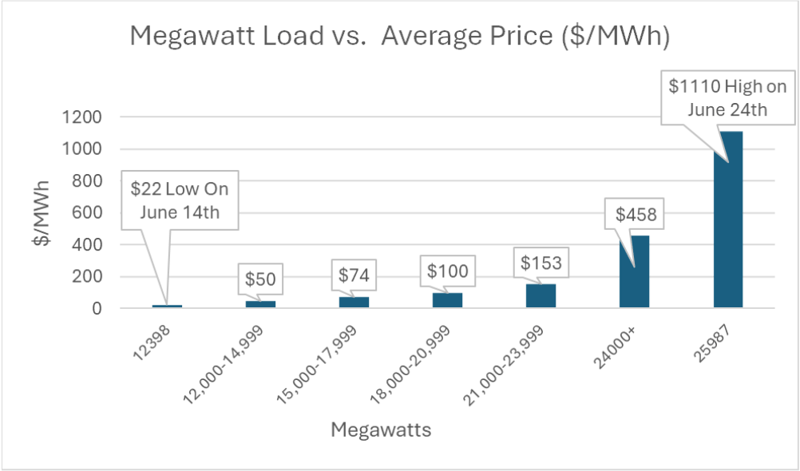
With electricity prices on the rise, it’s more important now than ever for consumers to understand how peak demand can impact their bills. The average price of electricity this summer was $106 ($/MWh). To break this down further, let’s take a look at the average prices constrained by peak demand load:
|
Peak Load (MW) |
Average Price ($/MWh) |
|
12,000-14,999 |
$50 |
|
15,000-17,999 |
$74 |
|
18,000-20,999 |
$100 |
|
21,000-23,999 |
$153 |
|
24,000+ |
$458 |
The jump from the 21,000-23,999 MW bracket to the 24,000+ MW bracket speaks for itself. For an increase of a few thousand megawatts, a difference of $305 is a steep price to pay. That’s why our Shave the Peak alerts are sent on days when demand exceeds 22,000 MW. Beyond this threshold, electricity prices spike because ISO-New England relies on “peaker plants,” expensive last resort generators that typically run on gas or oil or even coal. While they only operate during the highest-demand hours, accounting for about 2-7% of the year's power generation, the data shows that their impact on costs is enormous.
On the day, June 24, with the highest peak demand this summer (almost 26,000 MW), the price of energy hit an unbelievable $1,110. Conversely, the lowest price of the Summer was only $22, just 10 days before on June 14, and unlike the highest price, it was not on the same day as the lowest peak demand.
Emissions are another important piece of our Shave the Peak puzzle. Not only is peak demand expensive, but it’s also costly for our environment. Peaker plants are energy resources that release significantly more pollution per unit of energy than other power plants. In addition to carbon dioxide, they release fine particulate matter, nitrogen oxide, and sulfur dioxide into surrounding communities, which are typically low-income and populations of color. Short-term exposure to these pollutants can cause wheezing, coughing, shortness of breath, and asthma attacks, but long-term exposure to these pollutants can affect the entire body. Research from the American Lung Association and Johns Hopkins University shows the following impacts on the body:

This summer the average emissions at the time of peak demand were 89 metric tons of CO2. Let’s break this average out into brackets constrained by peak demand load:
|
Peak Load (MW) |
Emissions (Metric Tons of CO2) |
|
12,000-14,999 |
69 |
|
15,000-17,999 |
85 |
|
18,000-20,999 |
93 |
|
21,000-23,999 |
111 |
|
24,000+ |
135 |
Similar to our price distribution, you see the largest jump in emissions between the 21,000-23,999 MW bracket and the 24,000+ MW bracket. The data affirms that higher peak loads drive up emissions. Shaving the Peak provides the opportunity to reduce electric costs and simultaneously reduce emissions and the associated health risks.
9-5 Phenomenon
Believe it or not, the 9-to-5 work schedule has negative impacts on environmental health and energy conservation. Our commutes to and from work contribute to increased emissions from personal vehicles and public transportation. The 9-to-5 schedule also creates time constraints throughout the day, forcing an uptick in energy use immediately following the end of the workday. When people return home from work, they plug in their EVs, turn on their TVs, run a load of laundry, and crank up their AC units, ultimately contributing to peak electricity demand. The workday structure drives our peak demand window (4-8 PM), with peaks often occurring from 6-8 PM.
Let’s take a look at a graph from June 20th (a weekday) plotting metric tons of CO2 being released against time. 
As you can see, there is an uptick in emissions in the morning that eventually tapers off once people have arrived at their jobs. In the midafternoon, we start to see emissions climb again as people are steadily getting off work, commuting home, and turning on appliances in their homes.
This summer, the days most likely to see electricity demand below 20,000 MW were Fridays (20%) and Saturdays (19%), with Sundays (15%) close behind. On the flip side, demand was most often above 20,000 MW on Mondays (22%) and Tuesdays (22%).
To what extent you can work from home, take public transportation over a personal vehicle, carpool, bike, or walk to work, could have an impact on energy demand and emissions. If you have an EV, participate in managed charging and schedule your charging session for a time after 9 PM to avoid peak times.
Behind the Meter (BTM) Solar
ISO-NE defines BTM solar, or rooftop solar, as Settlement Only Generation (meaning its output is not visible to ISO-NE and non-dispatchable) and load reducers for which ISO-NE does not monitor output in real-time. Behind-the-meter solar is a resource that produces energy that would otherwise come from other generation sources on the grid, likely dirty coal or natural gas power plants. It creates what’s known as the “duck curve,” where grid use dips midday because rooftop solar is strongest during that time and supplies electricity to the homes that have it. It also introduces the added benefit of a “price effect”. When the amount of expensive electricity being provided by power plants is lowered by BTM solar, the price that all utilities pay is reduced. In short, this means that BTM solar provides a dual benefit of avoiding the use of dirty generation sources and lowering the price of electricity for everyone in the region. Synapse Energy Economics estimated that between 2014 and 2019, BTM solar reduced wholesale energy market costs in New England by $1.1 billion.
For example, on the highest-peak day of June 24, solar played a critical role in the grid’s resilience during that time. According to the Acadia Center, behind-the-meter solar met around 22% of system load, translating to more than 5,000 MW of distributed solar generation. This helped suppress demand, prevented blackouts, and saved customers collectively between $8.2 million and potentially $19.4 million in energy costs.
Based on our data collection, the average peak of BTM solar this summer was 19,291 MWh. The average time BTM solar peaks occurred throughout the summer was 3:43 PM. Time for the BTM solar peak occurring (adjusted for outliers) ranged from 11:25 AM to 6:35 PM. If you want to learn more about how ISO-NE reports on BTM solar, check out this explainer. In short, BTM solar lowers costs, cuts pollution, and makes the grid more resilient when we need it most.
Most Notable Days
Although most of our data was fairly straightforward, we had a few days out of the ordinary worth mentioning.
The lowest peak load occurred on Saturday, June 14, at 12,327 MW, while the highest peak occurred on Tuesday, June 24, at 25,987 MW. Let’s compare some stats on these two days.
Our low peak day, June 14, was a weekend where temperatures were at a moderate 63 degrees. Compared to other days with higher peak demands, the price of electricity and CO2 emissions were not uncharacteristically low.
Our high peak day, June 24, was a weekday when temperatures reached 98 degrees. Electricity prices hit a whopping $1,110 at 7 PM. We also saw the highest CO2 emission on this day at 148 Metric Tons. Yes, we did send out a Shave the Peak notification on this day.
One day that really stood out in our data this summer was Thursday, June 26. For this day, the peak electricity load occurred right at midnight, an unusual time compared to the typical late afternoon or early evening peak. Below is the load graph for June 25, a typical load shape, followed by the load graph for June 26, an atypical load shape.
June 25
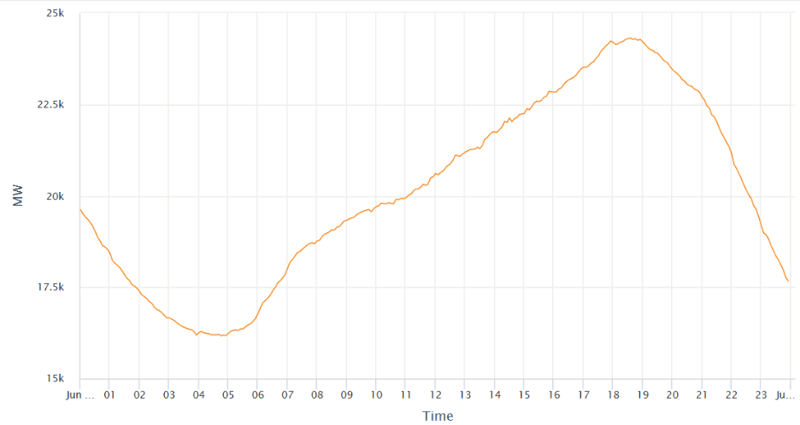
June 26
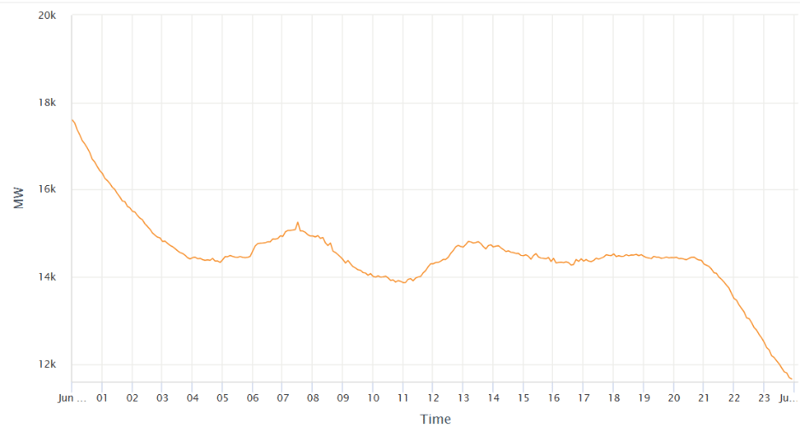
What likely happened is that following a massive heat wave that produced the season’s peak day on the 25th, electricity demand remained high even past midnight as people continued running their air conditioners through the night. The following day, temperatures dropped significantly, only reaching about 75°F, which felt cool in comparison. After days of intense heat and continuous AC use, many people likely shut off their ACs in the morning and left them off for most of the day. This sudden drop in cooling demand explains the unusual shape of the load curve, with high overnight consumption followed by relatively lower daytime usage.
Summer Recap
Throughout this summer, we ended up sending Shave the Peak alerts to our subscribers for a total of 6 Shave the Peak events. These events ranged from one Shave the Peak day to four consecutive days of increased demand. We want to thank everyone who is signed up for the alert system and participated in Shaving the Peak during times of high demand this summer. If you’re currently not signed up, it’s not too late!
As we head into fall, the forecast above shows daily energy demand peaking at about 318,000 MWh on September 25. The 21-day outlook also points to below-average demand, suggesting a lighter energy load as we move from the hot summer months into the cooler, crisper days of autumn. Thanks for following along with us this season — we’ll be back with more updates next year!
Maya was our 2025 summer intern and is now working at the Mass. Clean Energy Center. Amanda is our Clean Energy Program Manager.
Comments