As summer approaches, thousands of our followers are preparing to “Shave the Peak.”
Shave the Peak is our program designed to inform people, via text and email alerts, how and when to reduce power use on days when demand for electricity is significantly higher than usual.
As we begin to see temperatures rise above 90°F this summer, skyrocketing demand on the power grid leads to increased fossil fuel consumption and increased wholesale prices (which ultimately get passed onto retail customers – us). Oftentimes, the New England power system sees demand peaking just as solar power production tails off at dusk and it’s still hot. “Peaks” on a given summer day refers to the hour that demand was highest (for example, 6 PM). Shave the Peak alerts often recommend saving energy during a typical window of 4-8 PM, depending on the day’s specific conditions.
Peak days are a major factor in regard to pollution and the cost of our electricity.
How You Can Shave the Peaks
 This summer, subscribers to Shave the Peak will receive text and email alerts on peak days with information on individual actions that can help reduce overall electricity usage during peak demand hours. If you’re subscribed (it’s free), you will receive an alert the day before and the day of a potential peak.
How do we determine when to send peak alerts? We will be watching the weather forecasts and electricity demand forecasts from ISO-New England, the non-profit Independent System Operator with a responsibility to maintain reliable electricity to the six New England states. (You can track these data yourself through the informative and user-friendly ISO-to-go app.) In 2022, the average maximum supply for the 12 months at peak hour was 16,740 MW. In comparison, the maximum for August was 22,413 MW. On the occasions when New England’s demand is expected to rise over approximately 22,000 MW, we will see that as a time to communicate with subscribers.
Peak vs Off-Peak
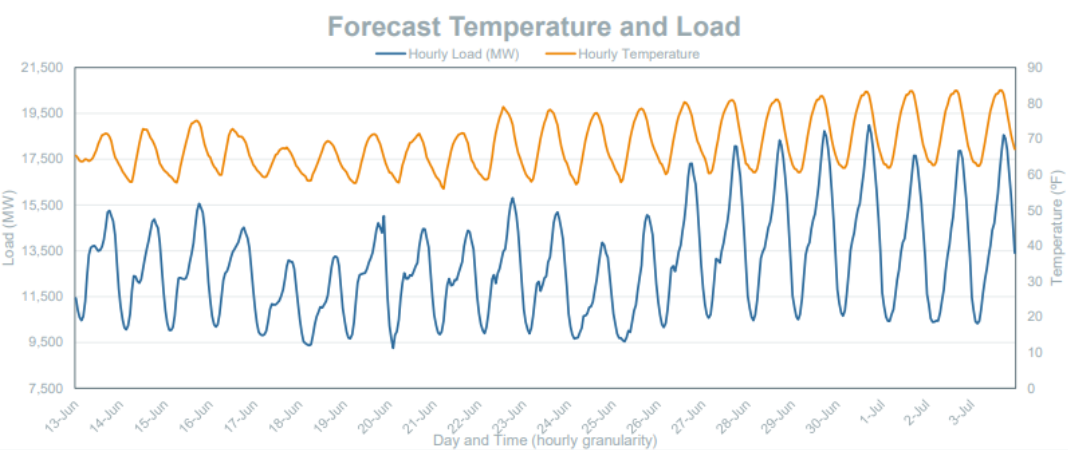
The graph below from ISO-NE is a 21-day hourly load forecast between June 13, 2023 – July 3, 2023. The blue line represents the hourly load (energy usage measured in megawatt hours) forecast and the orange line represents the temperature. The chart shows how as summer temperatures begin to rise, the peak demand rises in correlation with it. ISO-NE publishes these graphs every 2 weeks. As you can see, the trend is upward as spring turns to summer. While the average household might use about 600 kilowatt hours per month over the entire year, usage rises significantly in the summer.
Peaker Plants and Environmental Justice
To fill the increased electric demand on peak days, the grid must turn on peaker power plants. Peaker power plants are often old, dirty, and incredibly expensive to operate. They run primarily on natural gas and oil. Shaving the peak, therefore, means reducing the amount of fossil fuels emitted.
Peaker plants are a driver of local air pollution, releasing not only greenhouse gases but also pollutants like sulfur dioxide that gravely harm our lungs and tend to disproportionately affect low-income and minority populations.
If we can reduce peak demand by shaving the peak (and other methods of grid modernization), these dangerous, dirty peaker plants will no longer need to be kept online.
The Duck Curve
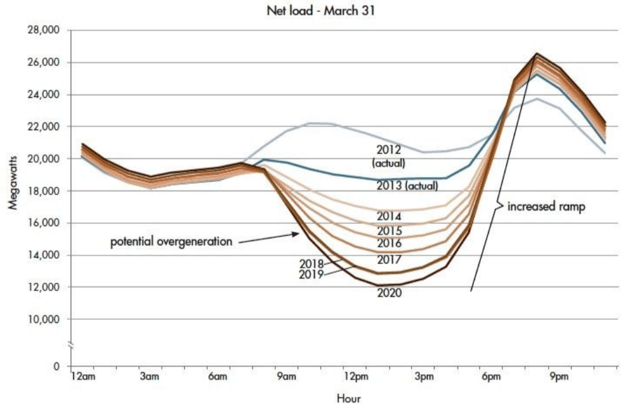 Behind-the-meter (BTM) solar has been crucial in lowering emissions during the day (BTM solar refers to solar that is produced at residential and commercial properties). Peak demand used to occur early in the afternoon, but as more homeowners and businesses install solar around New England, peak electricity demand has been pushed from the early afternoon to the evening.
The Duck Curve graph (named after its resemblance to a duck) shows the dip in an electricity demand that occurs in the afternoon as a result of production from tens of thousands of rooftop solar projects helping to reduce demand on the larger grid. As the amount of solar power increases, the curve deepens because the solar covers demand, so grid demand decreases. However, once the sun begins to set for the day, the demand increases considerably, before subsiding overnight. That window is when peaks occur. (The graph above is provided by California Independent System Operator.)
How significant is the difference between a peak day and a non-peak day?
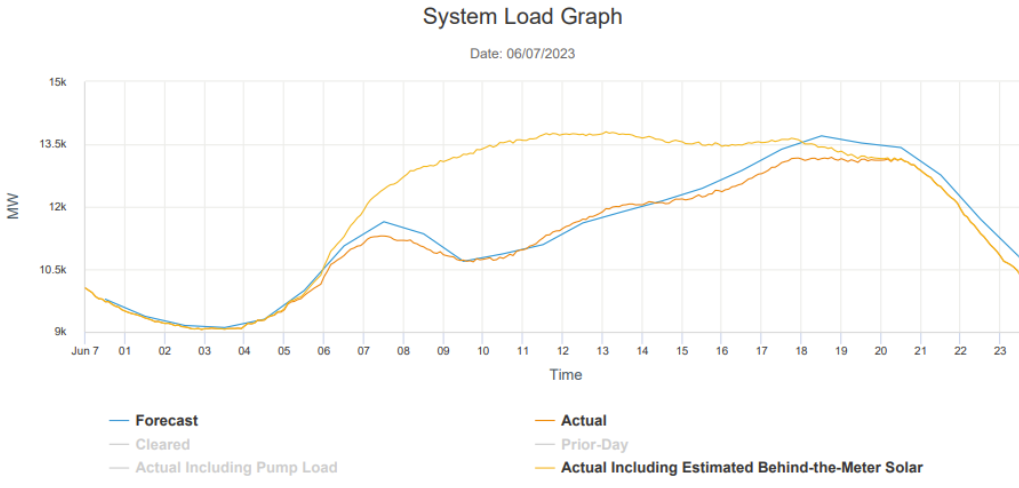
The following System Load Graphs from ISO-NE demonstrate the differences in electricity demand on a peak day versus an off-peak day. The graphs show how the demand on the New England electric grid was 24,333 MW on August 4, 2022, a summer peak day, vs. 13,186 MW on June 7, 2023, a spring non-peak day. That’s a huge difference.
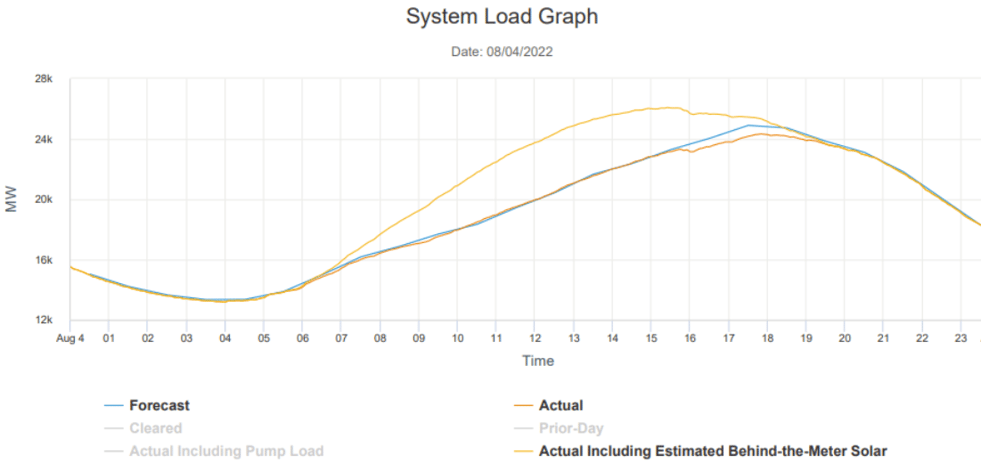
August 4 was one of the peak events during the summer of 2022. The average temperature in Boston was 83.06°F with a high of 97°F. The peak, demonstrated with the orange line, was a net demand of 24,333 MW at 5:50 PM. We might expect similar peaks this July and August. The good news is that behind-the-meter solar, represented by the yellow line, reduced the maximum load demand from a gross figure of 26,085 MW (in other words, BTM solar met the need for nearly 2000 MW of power, so less fossil fuel was used than would have been without it).
The System Load Graph from June 7, 2023 represents a cooler, typical spring day in New England with an average temperature in Boston of 61.17°F with a high of 65°F. The daily peak was 13,186 MW at 6:45 PM. Behind-the-meter solar reduced the maximum load from 13,798 MW.
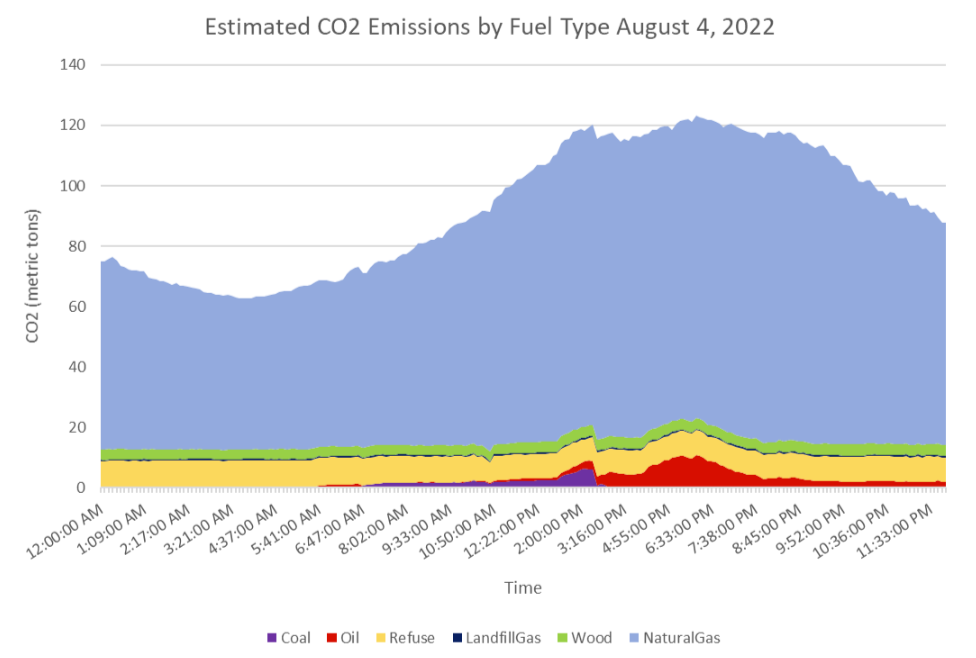
Carbon Emissions of Peaks
Data provided by ISO-NE on a peak summer day demonstrates how increased demand for electricity during peak times increased the amount of carbon dioxide emitted. The peak on August 4, 2022 occurred at 5:50 PM. The graph below demonstrates how the most metric tons of carbon dioxide were emitted at this peak time caused by the burning of an extraordinary amount of gas and oil. The burning of these fuels causes more than climate change. It is also extremely unhealthy.
Electricity Grid Costs
 It is essential to shave peak demand in order to reduce electricity costs for consumers. When peak demand increases, it becomes more expensive to run the electric grid, driving up costs for retail consumers – all of us.
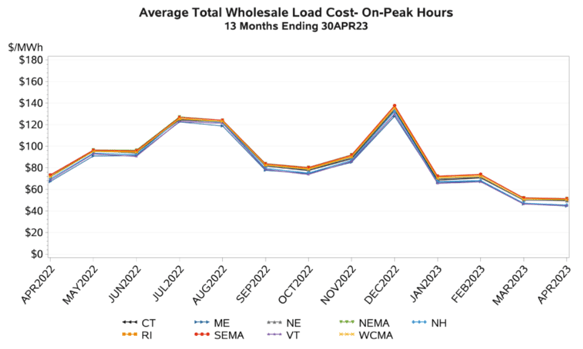
This line graph, published by ISO New England in April 2023, represents the average total wholesale cost of electricity demand (referred to as “load” in the chart) on-peak and off-peak hours. In addition to the spike in December 2022 that was due to the war in Ukraine, the data demonstrate how average total wholesale costs increase in the summer months on-peak hours. The graph also shows how prices in the summer months are higher than in the spring and fall.
In July 2022, the total wholesale rate ($/MWh) was $127.24 on-peak hours, compared to $94.28 off-peak load. In August 2022, the total wholesale rate ($/MWh) was $124.27 on-peak hours compared to $100.04 off-peak.
How to Shave the Peak: #1 – Use less A/C
 Yes, you as an electricity consumer can do something about peak!
First of all, you can let us help you by signing up for peak alerts here.
Second of all, you have the power to make small changes on hot summer afternoons that matter. One of the most impactful ways for you to save energy at summer peak hours is by turning your air conditioning off or setting it to run at a higher temperature. AC is so energy intensive that even a few degrees can make a big difference if that’s all you can do. For example, if you normally keep your AC at 75, try 78.
Pre-cooling your home or using fans during hot summer days are beneficial tactics to keep you cool and reduce peaks. You can focus your AC usage on a few rooms and get them nice and cool before 5 PM. At 5 PM, turn the AC up a few degrees, or turn it off if possible.
Additionally, it is important to shift your usage of large appliances such as clothes washers, electric dryers, machines, dishwashers, and electric vehicles to hours after the peak.
Shaving peaks can reduce electric grid costs, reduce emissions, and help phase out dirty power plants! Sign up to do your part in Shaving the Peak.
Comments